What does success on social media look like? There isn’t a one-size-fits-all answer. Success may look like growing quickly in a short time for a brand just getting started. For a long-established business, success looks more like staying relevant and maintaining its fan base.
But no matter where you are in your brand’s social media marketing strategy, it’s essential to keep an eye on certain data to reach your goals. These key performance indicators (KPIs) can tell you where you stand in your industry and keep your content fresh and engaging.
Whether you’re using an analytics tool or simply looking at the insights provided by the social media network, you may find yourself wondering what the KPIs mean and what matters most. We’ve broken down the top KPIs to watch for your brand’s social media success.

Start measuring your social media success with a free Rival IQ trial.
Get my free trial5 KPIs to Measure for Social Media Success
1. Reach
Reach is defined as the total number of people who choose to see and engage with your post where one person who views your post is equal to one unit of reach. If someone sees your post more than once, your reach does not increase. (That action would increase your impressions, but more on that later.)
Reach varies depending on follower count, as well as the channel. With a growing number of channels out there, your content has to compete for eyeballs with not only other posts on the same platform but other channels’ posts as well. According to our 2023 Instagram Stories Benchmark Report, reach declined for both Instagram posts and Stories. Brands with the largest following saw the smallest reach rate on their Instagram posts. With Instagram investing more in their Reels and with other platforms like TikTok in direct competition with Instagram, your post is fighting a lot for the attention of your audience.
When you measure reach, you’re getting an idea of whether or not you’re creating content your followers want to see. On Instagram, for instance, the algorithm prioritizes showing content to your followers if it believes that it’s something that they would want to engage with. If you’re creating high-quality content, your posts and Stories will continue to be shown to your followers, upping your reach.
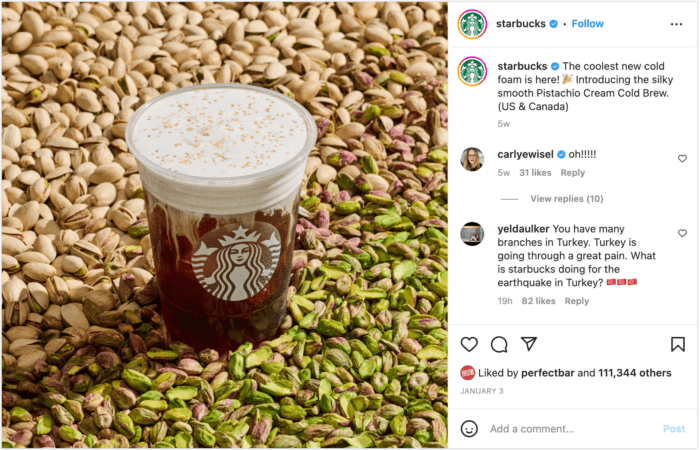
Consider this Starbucks post sharing the debut of the Pistachio Cream Cold Brew. Reach is a private metric that the Starbucks’ social media team would be able to see on their Instagram analytics page. But even from our end, we can get an idea of the reach. Between over 110K likes and 1.63K comments, the post received over 112K engagements. At the very least, we know that Starbucks reached 110K people with this post, assuming that some people both liked and commented on the post.
How can you increase your reach? There are a few factors to consider. Rival IQ will tell you when your best time to post is, which can help you share content during times your followers are more likely to engage. But ultimately, the best way to increase your reach is by sharing relevant content. Since Instagram will push content to your followers if it believes that they will take action on the post, you need to continuously put out posts and Stories that your audience wants to see. By studying which of your posts tend to get the highest reach, you can create more similar content to replicate the success.
You may need to experiment with your content. When it comes to social media, it’s important to test and retest. But to see what’s working and what isn’t, you’ll need to measure the results of your test. A social media analytics tool can help you see how your social media marketing efforts are working. By looking at the results of each post, you can invest more into the types of posts and Stories that get you the reach you need.
2. Impressions
Impressions and reach often get confused. They are similar, but there’s one significant difference. Reach is the number of people who see your content. Impressions are the number of times your content is seen. So, if one person sees your content three times, the unit of reach would remain at one while the number of impressions is three.
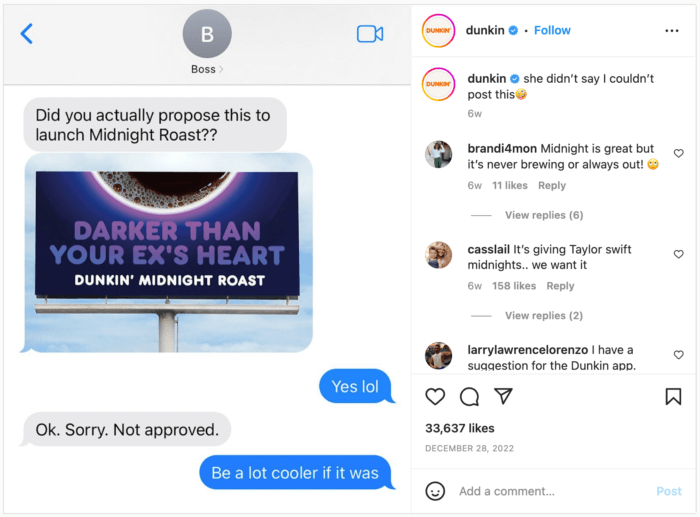
Your number of impressions will always be either equal to or greater than your reach, but it’s often greater. This post from Dunkin’ teasing their new Midnight Roast had a reach of at least 33.5K people out of 2.3M followers, but its impressions were considerably higher. Estimated impressions for this post came in at a whopping 695K, according to our analytics tool.
Much like reach, posting more relevant content will help you garner more impressions. You want to keep track of both your reach and your impressions to be sure you don’t see them begin to drop. Once these numbers drop, getting them back up can be very difficult. On Instagram, the platform will stop promoting your posts if they aren’t getting a lot of traction. But to get Instagram to begin pushing your content out to your followers, Instagram will need to see that your followers are interested in your posts, which is hard to do if your followers aren’t seeing your posts at all. Tracking both reach and impressions can prevent you from falling into this vicious cycle.
If you do begin to see your reach and impressions begin to fall, you have a few options to consider. Be sure you’re posting at optimal times. You may also want to consider if you’re posting too little or too much. According to our findings, the top 25% of brands by engagement rate are posting about 3.5x per week.
While it’s ideal to post content consistently, you could risk sharing content at non-optimal times if you’re posting too frequently. Posting too much at the wrong times can reduce the number of times your content is seen. On the other hand, posting too little or too infrequently can reduce Instagram’s ability to judge whether or not your followers want to see your content. By tracking your analytics, you can find a set schedule and frequency that works to reduce these risks.
3. Engagement Rate
There are many different ways to look at engagement rate, but let’s focus on two of the most prominent ways. The first is the engagement rate based on follower count, which is calculated by dividing the number of engagements by the number of followers. Before we can get into what makes for a good engagement rate, we need to talk about what engagement means in the first place. At Rival IQ, we define engagement as the measurable interaction on organic and paid social media posts. This interaction includes likes, comments, favorites, retweets, shares, and reactions.
Using engagement rate by follower can help you measure the overall success of your social media strategy. You can also use it to look specifically at how a post is performing.
The second form of engagement rate is based on the number of impressions. You’d need to know the number of impressions on each post to use it to see how your overall strategy is faring, which can make using this type of engagement rate more difficult to use than the engagement rate by follower because impression data isn’t as widely available as follower counts.
If you’re looking to compare how one post is performing to your average engagement rate, you’ll want to pick one type of engagement rate and stick to it. Your engagement rate by follower and your engagement rate by impression may be different. Comparing one post’s engagement rate by impression to your overall engagement rate by follower might result in some confusion over how that post is actually performing.
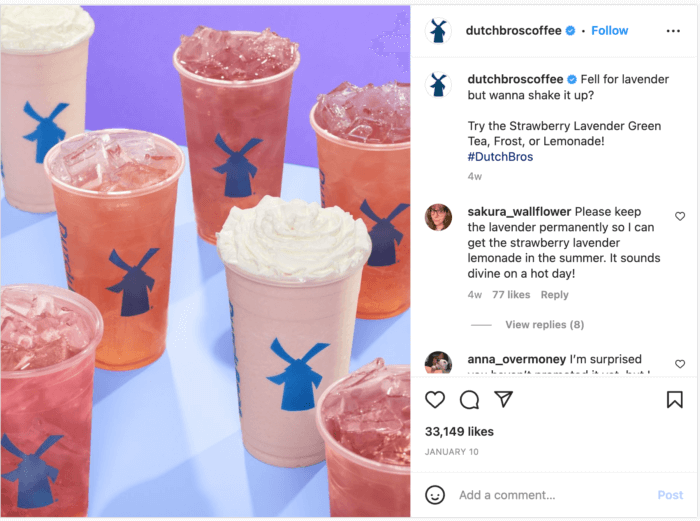
This post from Dutch Bros sharing the news of their new Strawberry Lavender drinks received 33.2K engagements. The post’s follower count engagement rate comes in at 4.34%, while the impressions engagement rate is higher at 5.86%. However, when considering all of Dutch Bros’ other posts for the past 30 days, their average engagement rate only came in at 0.77%.
According to our latest Social Media Industry Benchmark Report, the overall median engagement rate on Instagram is 0.67%. This rate applies to all industries, ranging from colleges and universities to beverage brands to fashion companies. But the median engagement rate for brands in the top 25% was found to be 1.39%. So, while 0.67% may be the median rate, you ideally want to aim for 1.39% or higher as a good engagement rate. If Dutch Bros.’ engagement rate comes out to 0.77%, they may not be performing as well as the top 25% of brands.
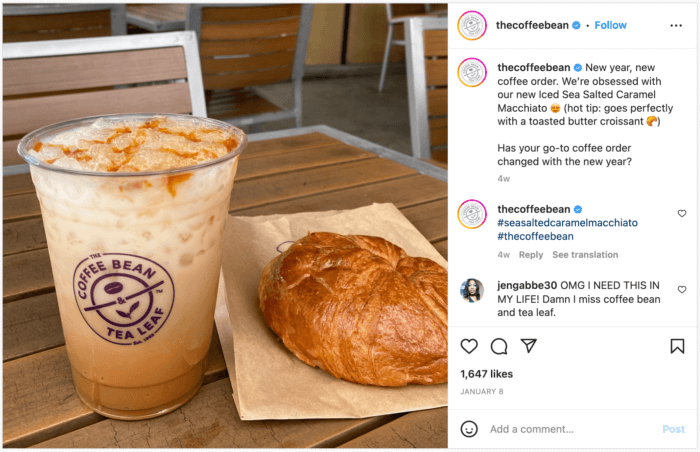
Still, they may want to consider posting more content similar to the posts that they’re getting more traction on, such as the above post. Or, using a competitive analytics tool, they could compare how their posts are performing against their top competitors’ content to take some tips on how to increase their engagement rate. This Coffee Bean & Tea Leaf post received an engagement rate of 1.37% by follower and demonstrates that certain tactics, like promoting a new product or asking a question in your caption, may be beneficial ways to boost engagement.
4. Mentions
As the name implies, this metric measures how many times a brand is mentioned on social media. You’ll want to track mentions in two major ways: your own mentions and your competitors’ mentions. Tracking mentions helps you get an idea of the brand awareness surrounding your company. And by analyzing both your and your competitors’ mentions, you can keep track of how much of the market each of you commands.
Keeping track of your competitors’ mentions allows you to determine what’s called share of voice. Share of voice means how much of the conversation online is focused on your company versus their company. To track mentions and share of voice, a social listening tool can be highly beneficial. Rival IQ’s social listening tool can help you see how often you or your competitor have been mentioned online by searching for a specific handle. However, you can also search by a particular hashtag on social channels, such as a branded hashtag that you’re using to boost brand awareness. By searching for mentions of these hashtags, you can see how your fans and influencers are performing online.

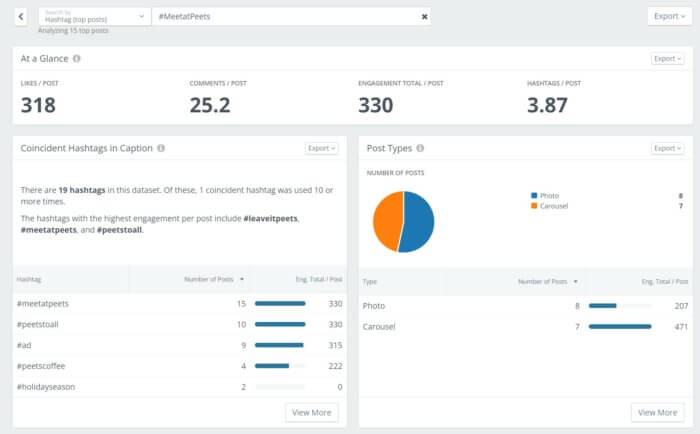
Peets Coffee often uses the hashtag #MeetatPeets, a branded hashtag that their influencers and fans adopted as well. According to our social listening tool, an analysis of 15 posts with the hashtag from the past year showed that the average engagement per post was 330.
In comparison, a look at a popular Starbucks hashtag, #StarbucksLover, showed significantly more posts in the past year. With 293 posts, the engagement total per post was 839. This disparity between Peets and Starbucks may demonstrate that Starbucks has a greater share of voice online.
Comparing your performance against your competitors is essential to help you understand where you stand in your industry. In addition to using the social listening tool to compare multiple social media accounts and hashtags, you can also use Rival IQ’s social analytics tools to compare other metrics like engagement rate, follower growth rate, and the number of posts published.
5. ROI
ROI stands for return on investment, and it’s an essential KPI to track to understand if you’re putting money in the right places during your social media campaigns. ROI is a general KPI, but we can break it down further by looking at the social media metrics that make it up.
When you look at ROI, you’ll want to analyze your conversion rate. Your conversion rate means how many times someone who sees your post or your influencer’s post purchases your product. Your conversion rate helps you understand other metrics, like the cost-per-click (CPC), which tells you how much you spent to reach those sales. You’ll need to measure your CPC against your conversion rate to see if you’re making enough sales to outweigh how much you’re spending.
To find your conversion rate, you’ll first need to set up your UTM parameters, which are short pieces of code you can add to links to track their performance. From there, you’ll divide the number of conversions by the number of clicks, as tracked by your UTM parameters. Multiply the result by 100, and you’ll have your conversion rate.
Your UTM parameters can also help you find your CPC. For your CPC, divide your total spend by the number of clicks the UTM parameters measured. For instance, say you paid $500 to an influencer. You then sent them the UTM-parameter-enabled link and measured 10,000 clicks on the link, which they put in their bio. Your CPC for this sponsored post would be $0.05.
It’s also essential to consider that there’s value in the brand awareness created by the post, even if someone didn’t purchase directly through a link online. Dunkin’ uses an influencer program to sell their at-home products using the hashtag #DunkinatHome. If we look at one such influencer’s post, @colormecourtney, we can see that it received 6.38K engagements.
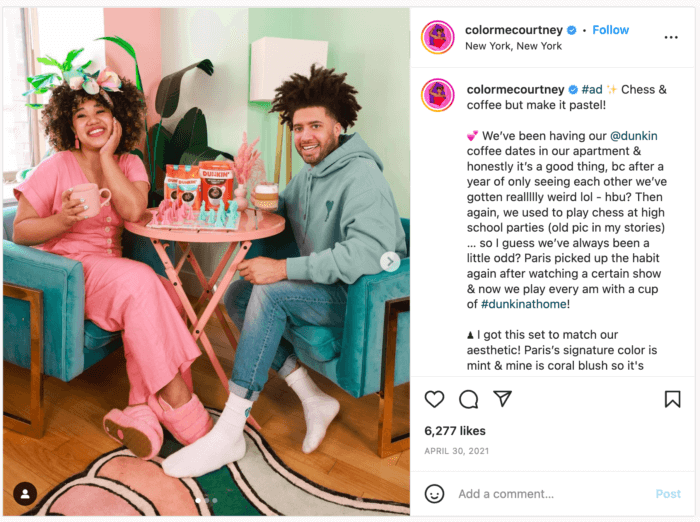
@colormecourtney also shared a link to purchase Dunkin’ coffee online. The Dunkin’ social team could track the conversion rate and CPC through the link, but there’s also an ROI concerning the added exposure the influencer gave by sharing Dunkin’ products with their audience. However, this metric is hard to track. It’s possible that the influencer’s followers saw the post and decided to go to the store or purchase online at another time, not through the link. Added complications like these can make ROI a tricky metric to nail down in the social media marketing world.
Wrapping It Up
Tracking your social media metrics can put you on a path to success. When you make choices on what to post and what to put your budget toward, you want to make informed decisions. That way, you’re reinvesting in a strategy that works for you and your bottom line. The more you create relevant content that your followers want to see, the higher your reach, impressions, engagement rate, and ROI will be. And the more you get your own name out there, the more you’ll find that your mentions are increasing, too.
However, tracking your own metrics is just one piece of the social media marketing puzzle. Analyzing your competitors’ metrics alongside your own can help you understand how much of the market you command, compare how your posts hold up against theirs, and ultimately stay ahead of the pack.